This tutorial will show the user how to run the Habnaba Profliing tools; the habana_perf_tool and the Tensorboard plug-in. These tools will provide the user valueable optimization tips and information to modify any model for better performance. For more information, please refer to the Profiling section of the documentation for info on how to setup the profiler and the Optimization Guide for additional background on other optimization techniques.
Initial Setup
We start with a Habana PyTorch Docker image and run this notebook. For this example, we’ll be using the Swin Transformer model from the Hugging Face Repository running on Hugging Face’s Optimum-Habana library.
Install the Optimum Habana Library, and the hugging face model examples
python -m pip install optimum[habana]
git clone https://github.com/huggingface/optimum-habana


cd optimum-habana/examples/image-classification
pip install -r requirements.txt
We will now see that our the utils file has the profiling fully instrumented:
cat -n ../../optimum/habana/utils.py | head -n 254 | tail -n 10

   245	            schedule = torch.profiler.schedule(wait=wait, warmup=warmup, active=active, repeat=1)
   246	            activities = [torch.profiler.ProfilerActivity.CPU, torch.profiler.ProfilerActivity.HPU]
   247
   248	            profiler = torch.profiler.profile(
   249	                schedule=schedule,
   250	                activities=activities,
   251	                on_trace_ready=torch.profiler.tensorboard_trace_handler(output_dir),
   252	                record_shapes=True,
   253	                with_stack=True,
   254	            )
Run Model to collect trace file (unoptimized)
Swin Transformer is a model that capably serves as a general-purpose backbone for computer vision. run_image_classification.py is a script that showcases how to fine-tune Swin Transformer on HPUs. We’ll use Swin Transformer for this example.
Notice the Habana specific commands:
--use_habana – allows training to run on Habana Gaudi--use_hpu_graphs – reduces recompilation by replaying the graph--gaudi_config_name Habana/swin – mapping to HuggingFace Swin Model config
Notice the torch profiler specific commands:
--profiling_warmup_steps 10 – profiler will wait for warmup steps--profiling_steps 3 – records for the next active steps
The collected trace files will be saved to ./hpu_profile; but copies will be moved to the ./swin_profile folder for reference.
python run_image_classification.py \
--model_name_or_path microsoft/swin-base-patch4-window7-224-in22k \
--dataset_name cifar10 \
--output_dir /tmp/outputs/ \
--remove_unused_columns False \
--image_column_name img \
--do_train \
--learning_rate 3e-5 \
--num_train_epochs 1 \
--per_device_train_batch_size 64 \
--evaluation_strategy no \
--save_strategy no \
--load_best_model_at_end False \
--save_total_limit 3 \
--seed 1337 \
--use_habana \
--use_lazy_mode \
--use_hpu_graphs \
--gaudi_config_name Habana/swin \
--throughput_warmup_steps 2 \
--overwrite_output_dir \
--ignore_mismatched_sizes \
--profiling_warmup_steps 10 \
--profiling_steps 3
At the end of the run you will see these results:
***** train metrics *****
  epoch                       =        1.0
  max_memory_allocated (GB)   =      92.25
  memory_allocated (GB)       =      90.84
  total_memory_available (GB) =      93.74
  train_loss                  =     0.2722
  train_runtime               = 0:03:27.66
  train_samples_per_second    =    240.412
  train_steps_per_second      =      3.762
Two ways to use HPU Performance Analysis tool
We can launch Tensorboard to see the performance analysis results; Both tools will provide the same information:
tensorboard --logdir xxx
Or simply use the habana_perf_tool to see the console output analysis:
habana_perf_tool --trace xxx.trace.json
Notice the contents of habana_perf_tool console output below.
Device/Host ratio – To show the overall performance, device utilizationHost Summary – Host side performance, to show dataloader, graph build, data copy and compileDevice Summary – Device side performance, to show MME, TPC and DMAHost/Device Recommendations – Performance Recommendations for model optimization.
For this case, we’ll use the Habana Performance Tools to run on the trace from this first run, and look for guidance on how to improve:
habana_perf_tool --trace ./swin_profile/unoptimized/UNOPT.pt.trace.json2023-07-19 22:07:04,476 - pytorch_profiler - DEBUG - Loading ./swin_profile/unoptimized/UNOPT.pt.trace.json
Import Data (KB): 100%|█████████████| 200068/200068 [00:01<00:00, 101312.72it/s]
2023-07-19 22:07:07,468 - pytorch_profiler - DEBUG - Please wait for initialization to finish ...
2023-07-19 22:07:15,881 - pytorch_profiler - DEBUG - PT Track ids: BridgeTrackIds.Result(pt_bridge_launch='46,51,6', pt_bridge_compute='15', pt_mem_copy='6', pt_mem_log='', pt_build_graph='48,49,45,5')
2023-07-19 22:07:15,881 - pytorch_profiler - DEBUG - Track ids: TrackIds.Result(forward='4', backward='44', synapse_launch='0,47,50', synapse_wait='1,9', device_mme='40,41,42,43', device_tpc='16,17,18,19,20,21,22,23,24,25,26,27,28,29,30,31,32,33,34,35,36,37,38,39', device_dma='7,10,11,12,13,14')
2023-07-19 22:07:18,228 - pytorch_profiler - DEBUG - Device ratio: 61.66 % (288.393 ms, 467.734 ms)
2023-07-19 22:07:18,228 - pytorch_profiler - DEBUG - Device/Host ratio: 61.66% / 38.34%
2023-07-19 22:07:19,098 - pytorch_profiler - DEBUG - Host Summary Graph Build: 14.50 % (60.240976 ms, 415.491 ms)
2023-07-19 22:07:19,288 - pytorch_profiler - DEBUG - Host Summary DataLoader: 55.98 % (232.607 ms, 415.491 ms)
2023-07-19 22:07:19,565 - pytorch_profiler - DEBUG - Host Summary Input Time: 4.62 % (19.187 ms, 415.491 ms)
2023-07-19 22:07:19,772 - pytorch_profiler - DEBUG - Host Summary Compile Time: 1.52 % (6.31 ms, 415.491 ms)
2023-07-19 22:07:20,245 - pytorch_profiler - DEBUG - Device Summary MME Lower Precision Ratio: 77.08%
2023-07-19 22:07:20,245 - pytorch_profiler - DEBUG - Device Host Overlapping degree: 81.88 %
2023-07-19 22:07:20,245 - pytorch_profiler - DEBUG - Host Recommendations:
2023-07-19 22:07:20,245 - pytorch_profiler - DEBUG - This run has high time cost on input data loading. 55.98% of the step time is in DataLoader. You could use Habana DataLoader. Or you could try to tune num_workers on DataLoader's construction.
2023-07-19 22:07:20,245 - pytorch_profiler - DEBUG - Compile times per step : [2]. Compile ratio: 1.52% (total time: 6.31 ms)
2023-07-19 22:07:20,561 - pytorch_profiler - DEBUG - [Device Summary] MME total time 88.28 ms
2023-07-19 22:07:27,530 - pytorch_profiler - DEBUG - [Device Summary] MME/TPC overlap time 57.94 ms
2023-07-19 22:07:27,531 - pytorch_profiler - DEBUG - [Device Summary] TPC total time 165.36 ms
2023-07-19 22:07:29,530 - pytorch_profiler - DEBUG - [Device Summary] DMA total time 29.43 ms
2023-07-19 22:07:29,530 - pytorch_profiler - DEBUG - [Device Summary] Idle total time: 5.32 ms
Code language: PHP (php)In this case you will see that the Data Loader is taking too much time in the HOST, and the tool is recommending that we try the Habana Dataloader or increase the number of workers used by the Data Loader, so let’s try that and see the result.
Apply optimization 1 (set dataloader num_workers)
Notice the command for optimization:
--dataloader_num_workers 4 – perform multi-process data loading by simply setting the num_workers to a positive integer
python run_image_classification.py \
--model_name_or_path microsoft/swin-base-patch4-window7-224-in22k \
--dataset_name cifar10 \
--output_dir /tmp/outputs/ \
--remove_unused_columns False \
--do_train \
--learning_rate 3e-5 \
--num_train_epochs 1 \
--per_device_train_batch_size 64 \
--evaluation_strategy no \
--save_strategy no \
--load_best_model_at_end False \
--save_total_limit 3 \
--seed 1337 \
--use_habana \
--use_lazy_mode \
--use_hpu_graphs \
--gaudi_config_name Habana/swin \
--throughput_warmup_steps 2 \
--overwrite_output_dir \
--ignore_mismatched_sizes \
--dataloader_num_workers 4 \
--profiling_warmup_steps 10 \
--profiling_steps 3
At the end of the run you will see these results:
***** train metrics *****
  epoch                       =        1.0
  max_memory_allocated (GB)   =      92.25
  memory_allocated (GB)       =      90.84
  total_memory_available (GB) =      93.74
  train_loss                  =     0.2853
  train_runtime               = 0:02:43.50
  train_samples_per_second    =    322.011
  train_steps_per_second      =      5.039
We’ll now run the Habana performance tool to see if the workload is more optimized on the Gaudi HPU:
habana_perf_tool --trace ./swin_profile/1st_optim_num_worker/1stOPT.pt.trace.json2023-07-19 22:05:39,782 - pytorch_profiler - DEBUG - Loading ./swin_profile/1st_optim_num_worker/1stOPT.pt.trace.json
Import Data (KB): 100%|█████████████| 177474/177474 [00:01<00:00, 102009.17it/s]
2023-07-19 22:05:42,539 - pytorch_profiler - DEBUG - Please wait for initialization to finish ...
2023-07-19 22:05:49,949 - pytorch_profiler - DEBUG - PT Track ids: BridgeTrackIds.Result(pt_bridge_launch='9,54,49', pt_bridge_compute='18', pt_mem_copy='9', pt_mem_log='', pt_build_graph='8,48,51,52')
2023-07-19 22:05:49,950 - pytorch_profiler - DEBUG - Track ids: TrackIds.Result(forward='7', backward='47', synapse_launch='0,50,53', synapse_wait='1,12', device_mme='43,45,46,44', device_tpc='36,30,26,31,23,25,35,19,29,38,24,22,33,37,27,20,41,32,28,34,40,42,39,21', device_dma='10,17,15,13,14,16')
2023-07-19 22:05:52,033 - pytorch_profiler - DEBUG - Device ratio: 90.84 % (283.428 ms, 312.02 ms)
2023-07-19 22:05:52,033 - pytorch_profiler - DEBUG - Device/Host ratio: 90.84% / 9.16%
2023-07-19 22:05:52,798 - pytorch_profiler - DEBUG - Host Summary Graph Build: 28.77 % (59.886976 ms, 208.177 ms)
2023-07-19 22:05:52,939 - pytorch_profiler - DEBUG - Host Summary DataLoader: 1.56 % (3.249 ms, 208.177 ms)
2023-07-19 22:05:53,161 - pytorch_profiler - DEBUG - Host Summary Input Time: 11.58 % (24.109 ms, 208.177 ms)
2023-07-19 22:05:53,343 - pytorch_profiler - DEBUG - Host Summary Compile Time: 2.28 % (4.746 ms, 208.177 ms)
2023-07-19 22:05:53,810 - pytorch_profiler - DEBUG - Device Summary MME Lower Precision Ratio: 77.08%
2023-07-19 22:05:53,811 - pytorch_profiler - DEBUG - Device Host Overlapping degree: 86.27 %
2023-07-19 22:05:53,811 - pytorch_profiler - DEBUG - Host Recommendations:
2023-07-19 22:05:53,811 - pytorch_profiler - DEBUG - 11.58% H2D of the step time is in Input Data Time. Step call times: [28, 28, 28]. You could try to set non-blocking in torch.Tensor.to and pin_memory in DataLoader's construction to asynchronously convert CPU tensor with pinned memory to a HPU tensor.
2023-07-19 22:05:53,811 - pytorch_profiler - DEBUG - Compile times per step : [2]. Compile ratio: 2.28% (total time: 4.75 ms)
2023-07-19 22:05:54,126 - pytorch_profiler - DEBUG - [Device Summary] MME total time 88.26 ms
2023-07-19 22:06:01,047 - pytorch_profiler - DEBUG - [Device Summary] MME/TPC overlap time 57.95 ms
2023-07-19 22:06:01,049 - pytorch_profiler - DEBUG - [Device Summary] TPC total time 165.50 ms
2023-07-19 22:06:03,065 - pytorch_profiler - DEBUG - [Device Summary] DMA total time 26.40 ms
2023-07-19 22:06:03,065 - pytorch_profiler - DEBUG - [Device Summary] Idle total time: 3.26 ms
Code language: PHP (php)You see that we now get a much better result, where we see the HOST ratio drop to 9% and the throughput improve by 30%. However, the tool is recommending trying using non-blocking data copy (Asynchonous copy) to streamline the code execution.
Apply optimization 2 (using asynchronous copy)
Notice the command for optimization:
--non_blocking_data_copy True – specifying the argument non_blocking=True during the copy operation, the Python thread can continue to execute other tasks while the copy occurs in the background
python run_image_classification.py \
--model_name_or_path microsoft/swin-base-patch4-window7-224-in22k \
--dataset_name cifar10 \
--output_dir /tmp/outputs/ \
--remove_unused_columns False \
--do_train \
--learning_rate 3e-5 \
--num_train_epochs 1 \
--per_device_train_batch_size 64 \
--evaluation_strategy no \
--save_strategy no \
--load_best_model_at_end False \
--save_total_limit 3 \
--seed 1337 \
--use_habana \
--use_lazy_mode \
--use_hpu_graphs \
--gaudi_config_name Habana/swin \
--throughput_warmup_steps 2 \
--overwrite_output_dir \
--ignore_mismatched_sizes \
--dataloader_num_workers 4 \
--non_blocking_data_copy True \
--profiling_warmup_steps 10 \
--profiling_steps 3
At the end of the run you will see these results:
***** train metrics *****
  epoch                       =        1.0
  max_memory_allocated (GB)   =      92.25
  memory_allocated (GB)       =      90.84
  total_memory_available (GB) =      93.74
  train_loss                  =     0.2853
  train_runtime               = 0:02:43.38
  train_samples_per_second    =    330.061
  train_steps_per_second      =      5.165
We’ll now run the Habana performance tool one final time to see if the workload is more optimized on the Gaudi HPU:
habana_perf_tool --trace ./swin_profile/2nd_optim_non_blocking/2ndOPT.pt.trace.json2023-07-19 22:04:37,679 - pytorch_profiler - DEBUG - Loading ./swin_profile/2nd_optim_non_blocking/2ndOPT.pt.trace.json
Import Data (KB): 100%|█████████████| 177495/177495 [00:01<00:00, 102617.38it/s]
2023-07-19 22:04:40,426 - pytorch_profiler - DEBUG - Please wait for initialization to finish ...
2023-07-19 22:04:47,805 - pytorch_profiler - DEBUG - PT Track ids: BridgeTrackIds.Result(pt_bridge_launch='56,9,51', pt_bridge_compute='15', pt_mem_copy='9,58,13,57', pt_mem_log='', pt_build_graph='8,50,53,54')
2023-07-19 22:04:47,806 - pytorch_profiler - DEBUG - Track ids: TrackIds.Result(forward='7', backward='49', synapse_launch='0,52,55', synapse_wait='1,12', device_mme='45,47,48,46', device_tpc='29,31,26,32,41,25,27,21,36,28,30,24,35,43,39,22,44,38,34,42,33,37,40,23', device_dma='10,19,17,20,16,18')
2023-07-19 22:04:49,814 - pytorch_profiler - DEBUG - Device ratio: 91.74 % (280.442 ms, 305.698 ms)
2023-07-19 22:04:49,814 - pytorch_profiler - DEBUG - Device/Host ratio: 91.74% / 8.26%
2023-07-19 22:04:50,555 - pytorch_profiler - DEBUG - Host Summary Graph Build: 33.66 % (67.771976 ms, 201.314 ms)
2023-07-19 22:04:50,699 - pytorch_profiler - DEBUG - Host Summary DataLoader: 1.69 % (3.412 ms, 201.314 ms)
2023-07-19 22:04:50,915 - pytorch_profiler - DEBUG - Host Summary Input Time: 1.33 % (2.687 ms, 201.314 ms)
2023-07-19 22:04:51,093 - pytorch_profiler - DEBUG - Host Summary Compile Time: 2.31 % (4.652 ms, 201.314 ms)
2023-07-19 22:04:51,552 - pytorch_profiler - DEBUG - Device Summary MME Lower Precision Ratio: 77.08%
2023-07-19 22:04:51,552 - pytorch_profiler - DEBUG - Device Host Overlapping degree: 87.45 %
2023-07-19 22:04:51,552 - pytorch_profiler - DEBUG - Host Recommendations:
2023-07-19 22:04:51,552 - pytorch_profiler - DEBUG - Compile times per step : [2]. Compile ratio: 2.31% (total time: 4.65 ms)
2023-07-19 22:04:51,867 - pytorch_profiler - DEBUG - [Device Summary] MME total time 88.22 ms
2023-07-19 22:04:58,786 - pytorch_profiler - DEBUG - [Device Summary] MME/TPC overlap time 57.90 ms
2023-07-19 22:04:58,788 - pytorch_profiler - DEBUG - [Device Summary] TPC total time 165.44 ms
2023-07-19 22:05:00,819 - pytorch_profiler - DEBUG - [Device Summary] DMA total time 33.71 ms
Code language: HTML, XML (xml)Summary of optimizations
First run
Device utilization 61.6%, host is heavy with data loader costs 55.9%; Recommendations: tune num_workers or use Habana dataloader
Second run (tune num_workers)
Device utilization up to 90.8%, but data copy costs 11.5% of host step time; Recommendations: try to set non-blocking in torch.Tensor.to and pin_memory in DataLoader
Third run (set non_blocking)
Device utilization up to 91.7%; the model is now highly optimized
Tensorboard Viewer
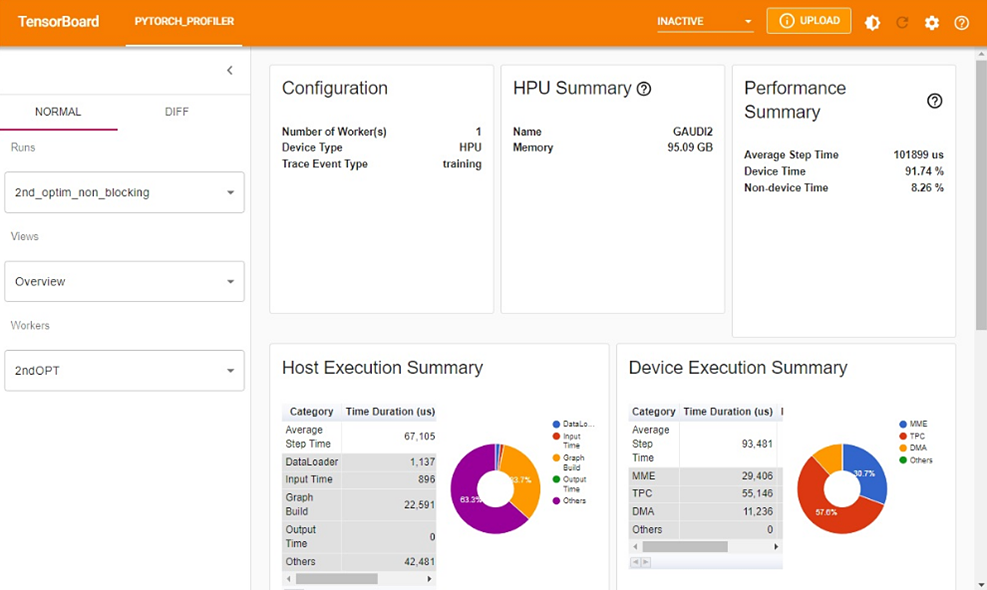
Finally, we’ll launch the Tensorboard Viewer for the last training run. The profiler can show three main sections:
HPU Overview
When using the TensorBoard profiler, the initial view will include a comprehensive summary of the Gaudi HPU, showing both the Gaudi Device execution information as well as the Host CPU information. You will be able to see the utilization of both Host and Device and see debug guidance at the bottom of the section that can provide some guidance for performance optimization
HPU Kernel View
The HPU Kernel view provides specific details into the Gaudi HPU kernel, showing the utilization in the Tensor Processing Cores (TPC) and the matrix multiplication engine (MME)
Memory Profiling
To monitor HPU memory during training, set the profile_memory argument to True in the torch.profiler.profile function.
See the Profiling section in the documentation for more information on instrumentation.
load_ext tensorboard
tensorboard --logdir=./swin_profile/2nd_optim_non_blocking/ --port 6006
from IPython.display import Image
img_path = 'tensorboard.jpg'
display(Image(img_path))

Summary
This Performance Tutorial will show how to setup a model for profiling and using the Habana Profiling tools; the habana_perf_tool and the Tensorboard plug-in. These tools will provide the user valuable optimization tips and information to modify any model for better performance.
Copyright© 2023 Habana Labs, Ltd. an Intel Company.
Licensed under the Apache License, Version 2.0 (the “License”);
You may not use this file except in compliance with the License. You may obtain a copy of the License at https://www.apache.org/licenses/LICENSE-2.0 Unless required by applicable law or agreed to in writing, software distributed under the License is distributed on an “AS IS” BASIS, WITHOUT WARRANTIES OR CONDITIONS OF ANY KIND, either express or implied. See the License for the specific language governing permissions and limitations under the License.


